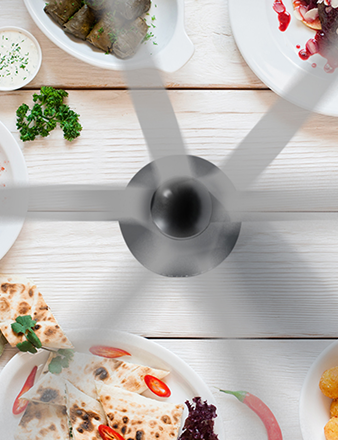
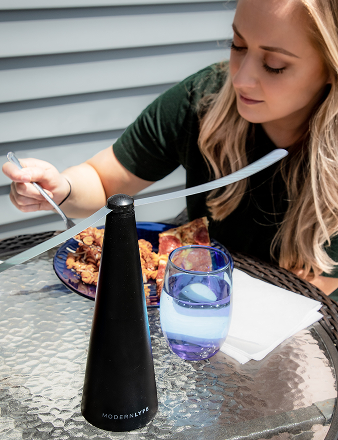
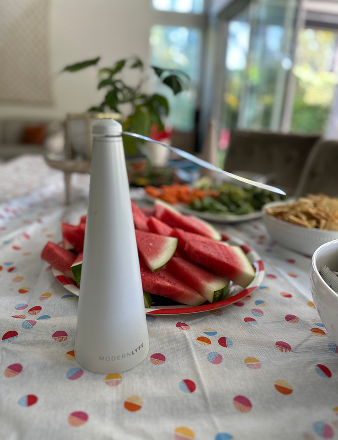
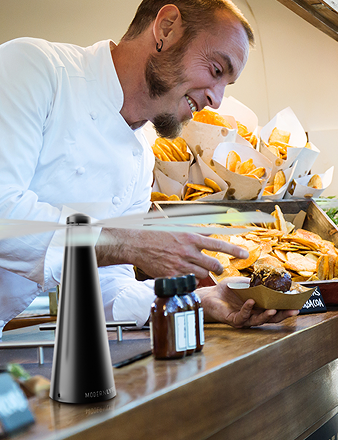
A restaurant owner is standing over a quote for a fly fan, a calculator open beside a stack of invoices. The question isn't whether the equipment looks useful. It's whether fewer fly complaints, fewer comped desserts, recovered patio tables, and less cleanup work will justify the installation cost when the decision is challenged by a partner, general manager, or lender.
That's the practical purpose of cost benefit evaluation. It turns a proposed purchase into a structured comparison of costs and benefits across a defined time horizon, then converts the result into decision measures such as net present value, return on investment, payback period, and benefit-cost ratio. Unlike a quick ROI estimate or an enthusiastic vendor pitch, a sound evaluation forces hidden operating costs, timing, uncertainty, and assumptions into the open.
The framework below uses a hospitality fly-fan purchase from start to finish. Every formula ties back to a line item a restaurant owner, hotel operator, caterer, or event coordinator could enter into a working decision sheet.
What a Cost Benefit Evaluation Actually Does for You
The manager has a quote, but the quote only answers one part of the question. It tells her what the equipment costs today. It doesn't tell her whether the investment will offset guest complaints, discounted checks, disrupted service, or staff time spent clearing insects from outdoor dining areas.
A cost benefit evaluation answers a more useful question: will this purchase pay for itself in a way I can defend? The answer needs more than a claimed sales lift. It needs a clear list of costs, a defensible estimate for each benefit, a time horizon, and a calculation that someone else can reproduce without relying on the manager's enthusiasm.
The method has deep historical roots in nineteenth-century economics. Modern policy practice is commonly traced to Jules Dupuit's 1844 work on roads, bridges, and consumer surplus, followed by major United States milestones in the 1930s and 1950s. The 1936 U.S. Flood Control Act embedded a rule that project benefits had to exceed estimated costs, while the 1950 Bureau of the Budget “Green Book” helped standardize modern analysis for river-basin projects. This history is documented in the review of cost benefit analysis development.
The output is a decision, not a spreadsheet
A spreadsheet is only useful if it changes or confirms a decision. For the fly fan, the decision might be to buy, delay, negotiate installation, test one patio zone, or reject the purchase.
A mental ROI check often misses recurring maintenance, electrical work, seasonal demand, staff time, and the value of money spent today rather than later. It can also count the same benefit twice, such as treating recovered tables as both additional revenue and fewer complaints without separating the two.
Practical rule: If another decision-maker can't trace a benefit back to an operating observation, invoice, schedule, or conservative assumption, don't present it as hard savings.
The rest of the evaluation should make assumptions visible before money leaves the business. That's what makes the recommendation repeatable and durable under scrutiny.
Building the Foundation for Your Evaluation
Start with one sentence: “Should we purchase and install fly fans for the outdoor dining area to reduce avoidable operating losses over the equipment's useful life?” Keep that sentence in front of the worksheet. If a proposed benefit doesn't help answer it, remove the line or place it in a separate analysis.
The first column is the complete cost of ownership, not just the equipment quote. Include the purchase price, installation labor, electrical work, consumables, maintenance, battery or power-related costs, and end-of-life removal. A cost that appears small can still weaken the result if it repeats every month or every season.
The second column contains benefits that the operation can defend. Possible lines include fewer guest complaints, fewer comped desserts, reduced table-turnover losses, lower pest-control service, staff time saved during cleanup, and a measured pricing premium for a more comfortable outdoor setting. Don't add every possible benefit automatically. Add only the ones supported by your own records, manager observations, or a clearly stated assumption.
Choose the period and discount rate
Match the time horizon to the asset's expected useful life. For equipment, five years is a practical planning period when the asset is expected to remain useful for that duration. Use the business's cost of capital when it's available. If it isn't, a conservative hurdle rate such as 8 to 12 percent gives the team a visible decision standard rather than a made-up promise of certainty.
The technical discipline matters. A rigorous analysis compares the future with the purchase against the future without it, rather than comparing before and after results. It should measure incremental impacts, exclude sunk costs and transfer payments, and avoid double-counting secondary effects, as outlined in the Handbook of Cost-Benefit Analysis.
| Line Item | Year 0 | Years 1-5 (annual) |
|---|---|---|
| Fly fan purchase | Quote amount | None |
| Installation labor | Contractor quote | None |
| Electrical work | Site estimate | None |
| Consumables | None | Actual or estimated recurring cost |
| Maintenance | None | Planned service and replacement cost |
| End-of-life removal | None | Record in final year if applicable |
| Complaint reduction | None | Conservative avoided-cost estimate |
| Recovered tables | None | Incremental contribution margin only |
| Comped desserts avoided | None | Observed frequency multiplied by average cost |
| Pest-control reduction | None | Avoided invoice cost |
| Staff cleanup time saved | None | Hours saved multiplied by loaded wage |
| Patio pricing premium | None | Include only if supported by pricing evidence |
Use this operational efficiency guidance as a useful reminder that the model should reflect how work moves through the operation, not just what appears on a procurement quote.
Turning Your List into Hard Numbers
The evaluation lives or dies on input quality. A precise formula can't rescue a benefit estimate that came from a vendor's optimistic projection or a manager's vague impression that “the patio will feel better.”
Use four monetization methods that hospitality operators can verify.
Direct prices belong to hardware and installation. Enter the supplier quote for the equipment, the installer's labor, and any electrical work. For this example, use a $4,800 installed cost, recorded as a Year 0 cash outflow.
Avoided-cost calculations work for complaints and comps. Count the relevant complaint or comp events during comparable service periods, multiply by the average cost of the response, and adjust for the share reasonably attributable to insects. If recovered tables generate contribution margin rather than total sales, use contribution margin. Revenue that merely passes through to food, labor, and other variable costs shouldn't be presented as profit.
Time savings should equal hours removed from cleanup or service disruption multiplied by the fully loaded hourly wage. Fully loaded means wages plus the employment costs the business carries. The fly-fan example includes $1,400 per year in saved staff cleanup time.
Revenue uplift needs the most discipline. A fly-free patio might support premium seating or a longer outdoor season, but only include that line if the operation can observe a pricing difference, stronger utilization, or a credible reservation pattern. For the example, estimated complaint reduction and recovered tables contribute $6,200 per year. Treat that estimate as a testable assumption, not a guaranteed result.
Put the assumptions into cash flows
Separate one-time spending from recurring benefits and costs. The worksheet should show when money leaves or enters the business, because timing affects present value.
| Cash Flow Line | Source | Y0 | Y1 | Y2 | Y3 | Y4 | Y5 |
|---|---|---|---|---|---|---|---|
| Purchase and installation | Quote | -$4,800 | $0 | $0 | $0 | $0 | $0 |
| Complaint reduction and recovered tables | Operating estimate | $0 | $6,200 | $6,200 | $6,200 | $6,200 | $6,200 |
| Staff cleanup time saved | Labor estimate | $0 | $1,400 | $1,400 | $1,400 | $1,400 | $1,400 |
| Consumables and maintenance | Operating estimate | $0 | Enter amount | Enter amount | Enter amount | Enter amount | Enter amount |
| Pest-control reduction | Invoices | $0 | Enter amount | Enter amount | Enter amount | Enter amount | Enter amount |
| Net cash flow | Sum of lines | -$4,800 | Calculate | Calculate | Calculate | Calculate | Calculate |
A useful business impact framework can help managers connect the purchase to service quality and workflow outcomes without turning every desirable outcome into a claimed dollar benefit.
Running the Core Calculations
Four metrics matter in the decision meeting.
Net present value, or NPV, discounts future net cash flows back to today. The formula is:
NPV = Year 0 cash flow + Σ future net cash flow ÷ (1 + discount rate)^year
At a 10 percent discount rate, $1,800 in annual avoided losses has a present value of $1,536 over a five-year horizon under the stated example calculation. The exact model still needs every recurring cost entered, but the point is clear: future benefits aren't worth the same as cash available today.
ROI uses the undiscounted totals:
ROI = (Total Benefit − Total Cost) ÷ Total Cost × 100
Payback period shows how long it takes to recover the initial outlay:
Payback in months = Upfront capital and installation cost ÷ Net monthly benefit
Benefit-cost ratio, or BCR, divides the present value of benefits by the present value of costs. A BCR above 1.0 is the basic green light. Below 1.0 is a red light unless a non-monetary requirement justifies proceeding.
| Year | Gross Benefit ($) | Discount Factor (10%) | Present Value ($) | Cumulative Net ($) |
|---|---|---|---|---|
| 0 | 0 | 1.000 | 0 | -4,800 |
| 1 | 1,800 | 0.909 | 1,636 | -3,000 |
| 2 | 1,800 | 0.826 | 1,488 | -1,200 |
| 3 | 1,800 | 0.751 | 1,352 | 600 |
| 4 | 1,800 | 0.683 | 1,229 | 2,400 |
| 5 | 1,800 | 0.621 | 1,118 | 4,200 |
Lead with NPV and BCR when presenting to owners because they show economic value and capital efficiency. Lead with payback when speaking to a GM who needs a simple operating decision, especially when cash recovery speed matters more than a full financial comparison. For practical explanations of the mechanics, compare the real-world ROI examples from MyOfficeOps.
Don't trust a single scenario. Vary the assumption most likely to fail, such as fly-season length, and recalculate every metric. A model that survives a harsh season assumption deserves more confidence than one that works only under perfect patio utilization.
Stress-Testing Your Numbers with Scenarios
A base case can look persuasive because it assumes the operating environment behaves as planned. For the fly-fan model, the central assumption is the length of the fly season.
The base case uses a 14-week fly season. The pessimistic case cuts the season to 9 weeks and raises installation labor by 20 percent. The optimistic case keeps the season at 14 weeks and compounds avoided losses by 5 percent per year as favorable guest reviews build.
| Scenario | Fly Season (weeks) | ROI (%) | NPV ($) | Payback (years) |
|---|---|---|---|---|
| Optimistic | 14 | 42% | Calculate from worksheet | 2.1 |
| Base | 14 | Use approved base assumption | Calculate from worksheet | Use approved base assumption |
| Pessimistic | 9 | 11% | Calculate from worksheet | 4.8 |
The exact NPV must come from the completed cash-flow worksheet, including maintenance, consumables, installation, and the selected discount rate. Don't fill that cell with a guess just to make the table look complete.
Run the test yourself by changing the season-length cell. Then adjust only the benefits tied to seasonal exposure, not unrelated savings such as verified labor reduction. This keeps the scenario honest and shows which part of the recommendation is fragile.
The optimistic case shouldn't become your budget. It's a ceiling. The pessimistic case is the negotiation tool, especially when a vendor's forecast assumes strong weather, full patio utilization, or a long season.
Forecast bias is a serious problem in public and private investment analysis. A major empirical review found conventional ex-ante benefit-cost ratios were commonly overestimated by about 50 to 200 percent, depending on project type, because costs were underestimated and benefits overestimated. Another review found only 7.8 percent of analyses achieved the highest quality score, while 29.5 percent were rated good or acceptable. These findings are summarized in the review of the cost-benefit fallacy.
Decision rule: if the base case still clears your hurdle rate after cutting the most generous benefit in half, the purchase is defensible.
Pitfalls That Quietly Skew the Result
The worst spreadsheet errors rarely look dramatic. They appear as a familiar line item with the wrong economic meaning.
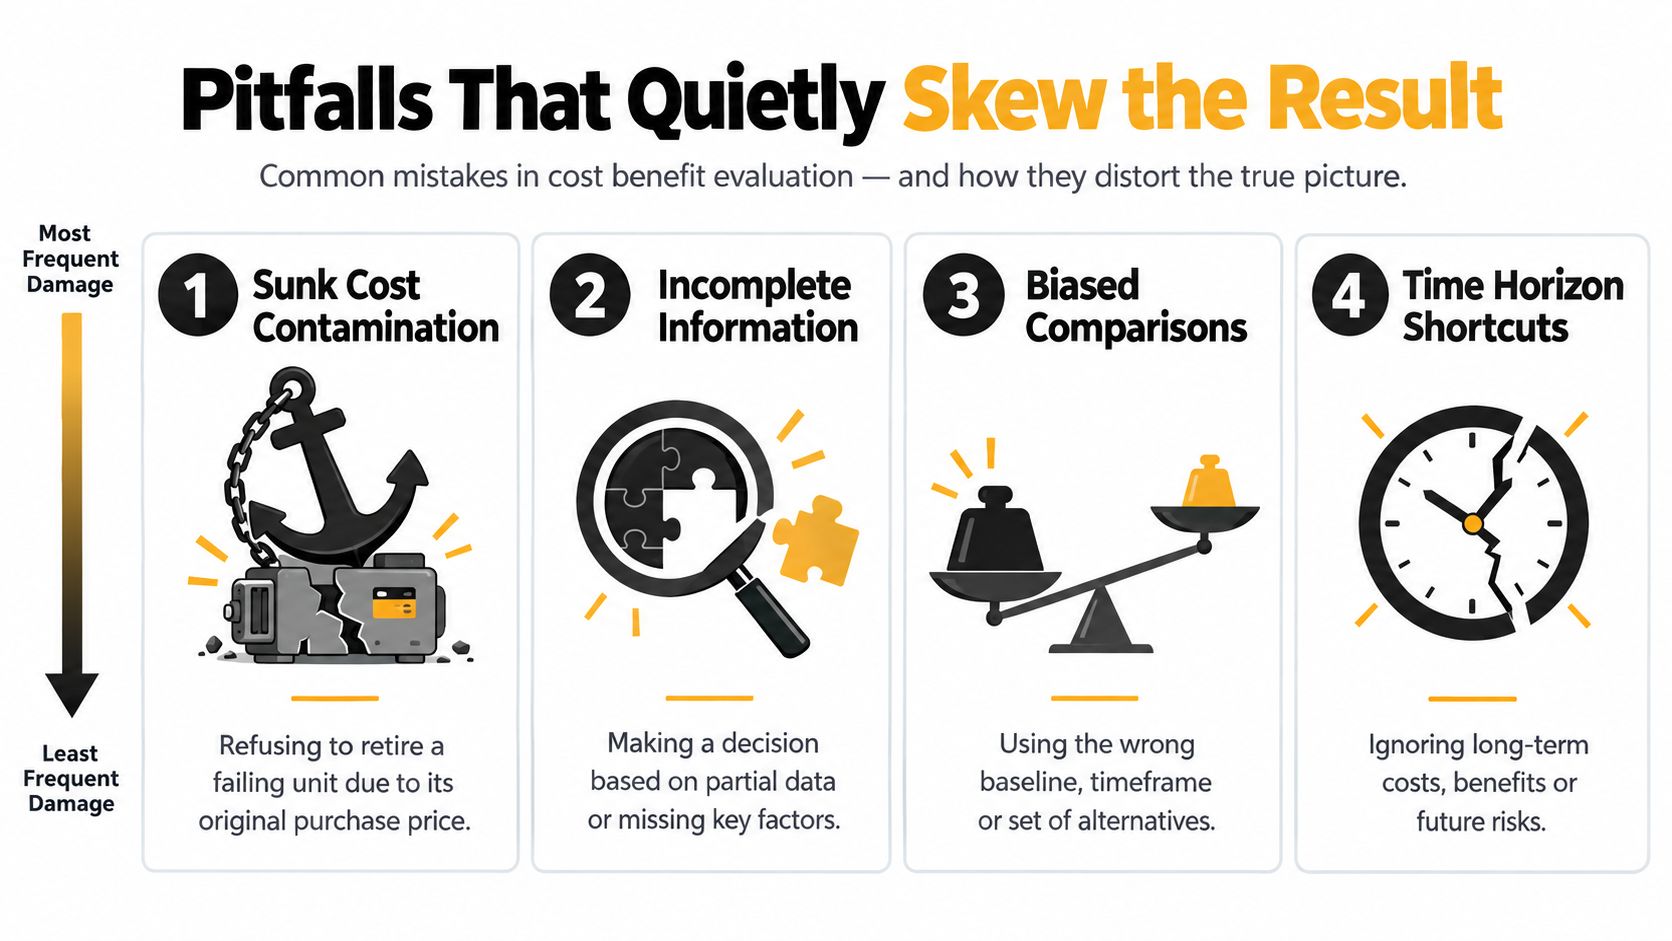
Sunk cost contamination appears when a manager refuses to replace a failing unit because the original purchase price feels too important to abandon. The symptom is an old invoice included in the new decision. Remove it. The fly-fan evaluation should contain future incremental costs and benefits, not money already spent.
Transfer payments masquerading as benefits occur when internal labor is moved from one task to another and the spreadsheet labels the shift as recovered revenue. The corrective move is to count staff time as a benefit only when it reduces paid hours, avoids overtime, or creates measurable productive capacity. Otherwise, record it as an operational improvement without monetizing it.
Vendor-driven forecast bias shows up when the complaint-reduction or recovered-table estimate matches a sales deck rather than the restaurant's own records. Replace the claim with observed complaint frequency, comp history, reservation data, or a deliberately conservative scenario.
Prevention bias is the hardest trap. Buyers undervalue equipment that prevents an incident because the avoided loss never appears as a revenue line. Regulatory guidance warns that preventive interventions can be difficult to value and that standard CBA may understate the value of avoiding future harm, especially in changing markets. The UK regulatory framework statement supports treating prevention as a real decision benefit, while still requiring disciplined assumptions.
Spreadsheet check: every benefit needs a source, every cost needs a timing, and every assumption needs a downside case.
Paste this checklist into the template:
- Remove sunk costs: Exclude original spending that won't change the decision.
- Separate transfers: Don't call internal reassignment new revenue.
- Challenge forecasts: Replace sales claims with operating records.
- Value prevention carefully: Record avoided complaints, hygiene exposure, and disruption without overstating them.
Presenting the Case and Locking in the Decision
Owners don't need every cell in the model. They need a one-page decision document that makes the recommendation easy to challenge and easy to approve.
Use three blocks.
| Section | Content | Notes |
|---|---|---|
| Headline result | NPV, payback, and BCR | State the discount rate and time horizon |
| Key sensitivity | The scenario that changes the decision most | For this purchase, test fly-season length |
| Recommendation | Go, no-go, or pilot | State the hurdle and approval trigger |
Under the headline, list the assumptions that matter. Identify the quote, installation estimate, complaint records, comp data, labor estimate, season length, discount rate, and maintenance plan. Pair each claim with a source row so a reviewer can trace the number without asking the analyst to rebuild the model.
Don't hide operational outcomes because they're difficult to monetize. Guest comfort, food presentation, staff workload, hygiene risk, and brand perception can matter to a restaurant, hotel, or events business even when a spreadsheet can't value them reliably. Guidance covering UK, NSW, and climate or program evaluation contexts notes that many effects can't be monetized reliably and that a simple ratio doesn't show who receives benefits or bears costs. The 2025 cost-benefit analysis report provides useful context for keeping those effects visible without pretending they're precise cash flows.
Make implementation part of the decision
The four-step habit is simple:
- Scope the decision: define the with-and-without comparison.
- Build the cash flows: separate Year 0 costs from recurring benefits and costs.
- Stress-test the weak assumption: change the seasonal or revenue-sensitive input.
- Set a measurement plan: compare actual results with the approved model.
Skip a full evaluation when the purchase is immaterial, the answer is already mandated by a safety requirement, or the cost of collecting better data exceeds the decision's practical value. Even then, record the reason and the minimum assumptions behind the approval.
Use strategic implementation guidance to turn the approved case into an operating plan. Set the purchase-order date, schedule installation before peak fly season, brief staff on placement and controls, and review results at 30, 60, and 90 days. Track complaints, comps, cleanup time, pest-control invoices, patio utilization, and guest feedback against the original assumptions.
MODERN LYFE offers elegant, battery-operated fly fans designed for restaurants, hotels, catering events, outdoor receptions, buffets, and home gatherings. If your cost benefit evaluation points toward a practical prevention investment, visit MODERN LYFE to review the available fly-fan solutions and choose the setup that fits your dining or event operation.