Friday night service is full, the patio is busy, and the problems all sound the same. Guests say the pace feels off. A server says one station is getting backed up. Someone at the host stand thinks wait times are worse than usual. The kitchen feels like it's pushing hard, but the floor still feels uneven.
That's what operations look like when a team is managing by instinct alone.
Most hospitality businesses aren't short on effort. They're short on clear performance metrics that tell managers what's happening, what's changing, and where to intervene before guest experience slips. Without that, every shift becomes reactive. You solve symptoms. You don't fix patterns.
The good news is that most operators already sit on useful signals. POS data, reservation patterns, service logs, guest comments, maintenance notes, event checklists, and staff observations can all become practical decision tools. The shift isn't about becoming “data-driven” in a corporate sense. It's about running a tighter floor, a cleaner buffet, a smoother banquet, and a more predictable guest experience.
From Chaos to Control with Performance Metrics
A restaurant manager usually doesn't need another abstract framework. They need fewer surprises at 7:30 p.m.
Take a common service problem. Patio guests start mentioning flies near shared plates and drinks. Staff move tables, swat the air, replace garnishes, and apologize. By the end of the night, the team remembers the frustration but not the pattern. Was it isolated to one zone? Did it start after food runners staged trays near the door? Did it happen only during a certain weather window? Without a metric, the issue becomes a story people retell instead of a problem they solve.
The same thing happens with wait times, slow room turns, buffet congestion, and setup delays. Teams rely on memory, and memory is selective.
A better operating rhythm starts when managers track a small set of measures that connect directly to service outcomes. If patio complaints rise on certain shifts, that's a signal. If one event format consistently creates longer setup time, that's a signal too. If equipment failures cluster at the wrong point in service, the team needs more than a maintenance note. They need a way to see trends.
Practical rule: If a problem keeps returning, it deserves a metric.
That doesn't mean drowning staff in reports. It means choosing a few measures that help you act earlier. Good performance metrics turn vague frustration into visible operating conditions. They help a manager ask better questions: Is this a staffing issue, a layout issue, a prep issue, or an equipment issue?
Operators who want a broader view of where efficiency breaks down can pair metric tracking with a practical look at hospitality operational efficiency. The combination matters because efficiency without guest context creates blind spots, and guest feedback without operational data creates guesswork.
What Are Performance Metrics Really
Performance metrics are your operating dashboard. Not your annual report. Not a spreadsheet you open after a bad month. A dashboard.
A car dashboard works because it shows the driver what needs attention now, what's trending in the wrong direction, and whether the vehicle is safe to keep pushing. Hospitality works the same way. Revenue tells you part of the story, but it doesn't tell you whether service flow is tightening, guest friction is building, or a recurring failure is about to disrupt a busy shift.

The four groups that matter most
Most hospitality teams work with four broad categories.
- Financial metrics track commercial output. Think room revenue, check average, labor cost trends, banquet profitability, and cost of goods behavior.
- Guest metrics reflect how the experience lands. Complaint themes, repeat booking behavior, review sentiment, service recovery patterns, and direct feedback all belong here.
- Operational metrics show whether the machine runs cleanly. Table turn pace, room turnaround readiness, event setup completion, maintenance response, and queue flow fit this group.
- People metrics tell you if staffing supports the experience. Schedule stability, training completion, role coverage, and avoidable handoff issues are often more useful than generic productivity talk.
The biggest mistake is treating all of these as equal. They're not. Some tell you what already happened. Others give you a chance to act before outcomes get worse.
According to NetSuite's explanation of actionable performance measurement, the most useful approach combines outcome measures, leading indicators, and benchmark comparisons. In practice, lagging indicators such as downtime or renewals describe what already happened, while leading indicators help teams predict future performance and intervene earlier. The same guidance stresses that the technical value comes from comparing metrics against prior periods and meaningful benchmarks so deviations are visible and causal hypotheses can be tested.
Leading and lagging indicators in hospitality
A lagging indicator is the final score. A leading indicator is the signal before the score changes.
For a restaurant, a lagging indicator might be guest complaints about slow service. A leading indicator might be drink ticket backlog, delayed first greet, or a growing gap between seating and order entry. For a hotel, a lagging indicator could be poor post-stay feedback. A leading indicator might be housekeeping delay patterns or front-desk queue buildup. For an event operator, lagging might be guest frustration during buffet service. Leading might be setup completion drift or equipment readiness issues.
A metric without context is just a number. A metric compared to trend and benchmark becomes a management tool.
If you want a useful cross-industry perspective on how teams structure digital measurement, Trackingplan's guide to ecommerce metrics is worth reading because it sharpens the same discipline hospitality teams need. Define the signal, validate the data, and connect it to a decision.
Teams that are redesigning their measurement habits should also think about process improvement in operations, because better metrics usually expose process flaws before they improve results.
Key Hospitality KPIs for Every Setting
Hospitality teams often track what's easiest to count instead of what matters most to the guest. That creates pretty reports and weak decisions.
The better approach is to pick KPIs by setting and by purpose. A hotel doesn't need the same scorecard as a caterer. A restaurant patio manager doesn't need the same dashboard as a wedding planner. More important, operators shouldn't stop at output metrics like covers served or units deployed. Public-sector and management research argues that organizations should use logic models to identify outputs, intermediate outcomes, and end outcomes because outcome indicators have historically been the missing metrics, as described in the Urban Institute's paper on performance measurement.
That's highly relevant in hospitality. Counting fan placements, room setups, or orders fulfilled is easy. Measuring whether those actions reduced service interruptions or improved perceived cleanliness is harder, but more useful.
Top Hospitality KPIs by Business Type
| Metric Category | Restaurant KPIs | Hotel KPIs | Catering/Event KPIs |
|---|---|---|---|
| Financial | Check average, menu mix, labor cost by shift, cost of waste | RevPAR, ancillary spend, event revenue mix, room-related labor trends | Cost per head, event margin by format, add-on attachment, overtime exposure |
| Guest experience | Complaint themes, repeat diner patterns, review sentiment, wait-time satisfaction | Post-stay feedback themes, check-in satisfaction, cleanliness perception, service recovery follow-through | Host satisfaction, guest flow feedback, perceived cleanliness, buffet satisfaction |
| Operational | Table turn pace, first greet timing, order-to-fire consistency, patio issue logs | Housekeeping turnaround readiness, maintenance response, queue flow at reception, banquet reset readiness | Setup completion accuracy, load-in timing, service line congestion, equipment readiness |
| Team and execution | Server section balance, training completion, handoff issues, shift coverage gaps | Front desk coverage stability, housekeeping handoff quality, event staffing readiness | Crew role clarity, setup labor efficiency, transport checklist completion, backup readiness |
| Outcome metrics | Reduction in fly-related interruptions at service, fewer food-presentation disruptions | Fewer guest complaints tied to outdoor dining or event areas, stronger cleanliness perception | Better buffet-line dwell-time satisfaction, stronger host ratings of event cleanliness |
What works and what usually fails
The best KPI sets answer one operating question each.
For example:
- Service speed question means you track waitlist friction, ticket pacing, and guest complaint themes.
- Outdoor dining quality question means you track table-side interruptions, food presentation issues, and cleanliness perception.
- Event execution question means you track setup completion, replacement response, and host feedback after service.
What fails is the usual pile-up of disconnected metrics. Teams end up tracking sales, labor, a review score, and maybe one maintenance figure, but none of them connect to one another.
A stronger model links action to outcome. If an operator changes outdoor table setup, introduces tighter buffet protection, or adjusts staff staging, the KPI should reveal whether guest interruptions fell and whether service became easier to execute. That's the standard to use when reviewing ways to improve guest satisfaction in hospitality settings.
If a KPI can't help a manager make a better shift decision, it probably belongs in a finance file, not an operating dashboard.
How to Measure What Truly Matters
Most hospitality businesses don't have a shortage of data. They have a shortage of discipline around what they collect, how they define it, and whether anyone uses it to improve the shift.
That's where metric systems go sideways. Staff spend time entering notes, exporting reports, and chasing status updates, but operations don't improve because the metrics weren't designed to support a real decision.

Start with decisions, not data
Before collecting anything, define the decisions your team needs to make faster or better.
That usually sounds like this:
- Where does service break down first
- Which guest complaints repeat often enough to justify process changes
- What equipment or setup issue creates avoidable disruption
- Which parts of the operation consume staff time without improving the guest experience
Once those decisions are clear, pick the few inputs that support them. Pull from sources your team already uses, such as POS logs, reservation timestamps, room inspection checklists, event setup sheets, maintenance tickets, and post-service feedback.
Avoid metric theater
Some metrics appear advanced and still make the operation worse.
Health-care literature warns that performance metrics can push delivery changes that don't align with customer priorities, consume staff time, and create negative effects on team function and care delivery, according to this discussion of unintended consequences in performance measurement. In hospitality, the parallel is obvious. If a team judges fly-fan performance only by units sold or uptime, they may ignore guest comfort, food presentation, staff setup time, and complaint reduction.
That's metric theater. The number looks clean, but the behavior it drives is wrong.
Watch for this: When staff start serving the metric instead of the guest, the metric needs to be redesigned.
A practical filter helps:
- Is it relevant to a guest or operational outcome you care about?
- Is it observable without creating extra admin burden every shift?
- Is it consistent enough that two managers would record it the same way?
- Is it actionable at the floor level, not just in a monthly review?
Simple collection methods that hold up
You don't need a complicated stack to get started.
- POS and reservation data can reveal pace issues, seating gaps, and timing friction.
- Short guest surveys work best when they target one service moment, not the entire experience.
- Observation checklists help with outdoor dining, buffet conditions, and setup readiness because they capture what systems often miss.
- Maintenance and replacement logs are critical for battery-operated equipment, mobile service tools, and anything used during live guest service.
The key is consistency. Define what counts as an interruption. Define what counts as a delayed setup. Define what counts as a successful recovery. If definitions drift, the metric becomes noise.
Building Your Performance Dashboard
A useful dashboard doesn't try to impress ownership. It helps a manager decide what to do in the next hour.
The best hospitality dashboards are spare, visual, and built around operating questions. One screen should tell a restaurant manager whether today's revenue pace is on track, whether service is tightening, and whether guest friction is showing up in a specific area of the floor. A hotel dashboard should surface room readiness, front-desk pressure, maintenance carryover, and live guest sentiment themes. An event dashboard should make setup status, replacement readiness, and service interruptions impossible to miss.

What a manager should see first
A clean dashboard usually starts with three layers.
First, show today versus target. This keeps the team anchored in current performance.
Second, show trend versus prior periods. That tells you whether the issue is new, recurring, or seasonal.
Third, show exceptions that need intervention. That might be one patio zone with repeated service interruptions, one event format with setup drift, or one shift pattern with more guest complaints than usual.
Many dashboards fail by displaying totals but hiding deviations. A manager doesn't need ten charts if one alert can point directly to a service breakdown.
Keep the dashboard tied to action
A restaurant dashboard might include revenue pace, table turn flow, open complaints by category, and one operational exception panel for outdoor dining. A hotel might show check-in friction, housekeeping completion status, unresolved maintenance items, and event-area readiness. A caterer may prioritize load-in progress, equipment issue logs, service line flow, and host feedback themes.
If you're evaluating software options, it helps to compare performance tracking tools with a practical eye for visibility, alerts, and reporting clarity. Fancy visualization matters less than whether the tool helps a manager act during service.
A short walkthrough can also help teams think through layout and reporting logic before building their own dashboard:
Good dashboards reduce meeting time because the problem is already visible.
Actions to Improve Your Top Hospitality Metrics
Metrics only matter if they change behavior on the floor.
The strongest operators review a small group of top measures and attach each one to a concrete action. That means no vague goal like “improve service” and no dashboard widget that nobody owns. If guest satisfaction slips, the team changes service recovery. If outdoor complaints rise, the team changes setup. If equipment disruptions repeat, the team changes maintenance and replacement process.

Guest satisfaction
Guest satisfaction improves when operators remove friction that guests notice immediately.
- Tighten first-response standards so staff know who owns a complaint and how quickly recovery starts.
- Reduce visible irritants in outdoor and buffet environments, especially anything that affects comfort, food presentation, or perceived cleanliness.
- Review complaint themes weekly instead of relying on memory from a single bad shift.
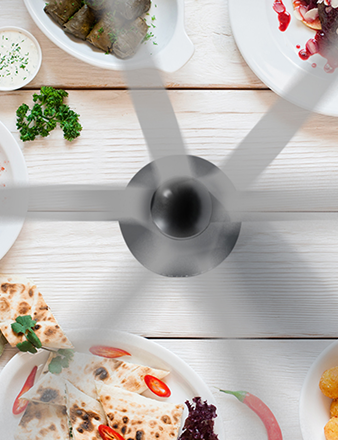
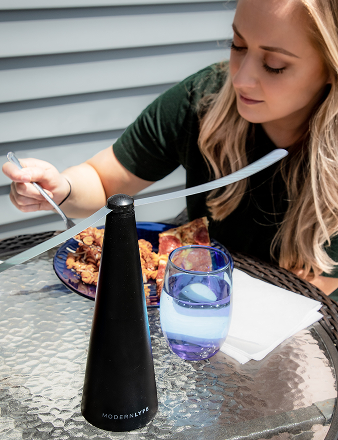
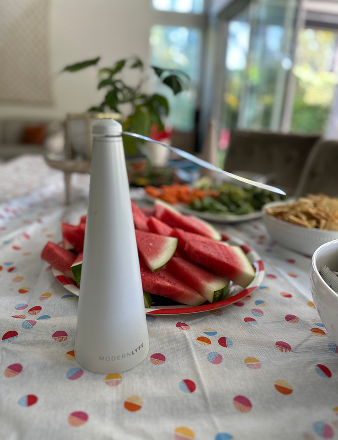
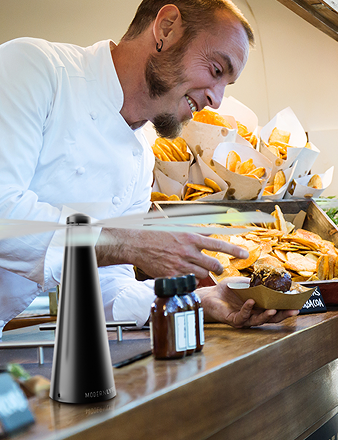
For outdoor dining and catered service, one practical option is MODERN LYFE fly fans. They're battery-operated units designed for tables, buffet lines, and event setups. The key metric isn't just whether the device runs. The more useful view is whether it helps reduce fly-related interruptions, supports food presentation, and lowers complaint frequency in affected service areas.
Operational reliability
Many hospitality teams often under-measure the problem.
A useful lesson from technical metric design is that you need to capture both failure frequency and recovery speed. ClearPoint's technical guidance notes that metric design should reflect both dimensions because operational impact compounds when incidents happen often and take longer to recover from, as outlined in this technical metrics guide. For a battery-powered fly fan during dinner service, a small increase in failure rate becomes more damaging if it also raises time to detect and replace the issue.
Track these operational measures:
- Incident rate for failures during service
- Mean time to detect a problem
- Mean time to repair or replace
- Sustained runtime under real operating conditions
Those four measures give managers a more honest picture than generic satisfaction scores alone.
Revenue and spend efficiency
Revenue usually improves when experience friction drops.
A cleaner patio, smoother event line, faster room readiness process, or tighter service handoff creates conditions for better spend behavior and fewer avoidable refunds or discounts. The move isn't to chase revenue directly in every moment. It's to fix the operational conditions that shape guest decisions.
The most profitable metrics are often the ones that protect the guest experience before a complaint ever happens.
If you're ready to turn recurring service issues into measurable improvements, MODERN LYFE offers fly-control solutions built for restaurants, hotels, caterers, and event setups. Use them as part of a broader performance metrics strategy focused on guest comfort, cleaner presentation, and smoother operations.